
The Visual Studio integrated development environment is a creative launching pad that you can use to edit, debug, and build code, and then publish an app. An integrated development environment (IDE) is a feature-rich program that can be used for many aspects of software development. Over and above the standard editor and debugger that most IDEs provide, Visual Studio includes compilers, code completion tools, graphical designers, and many more features to ease the software development process.
Visual Studio is available for Windows and Mac. Visual Studio for Mac has many of the same features as Visual Studio 2017, and is optimized for developing cross-platform and mobile apps. This article focuses on the Windows version of Visual Studio 2017.
There are three editions of Visual Studio 2017: Community, Professional, and Enterprise. See Compare Visual Studio 2017 IDEs to learn about which features are supported in each edition.
This overview article introduces you to the basic features of the IDE. We’ll walk through some things you can do with Visual Studio, including creating a simple project, using IntelliSense as a coding aid, and debugging an app to see the value of a variable during the program’s execution. We’ll also take a tour of the various tool windows.
Install the Visual Studio IDE
To get started, download Visual Studio 2017 and install it on your system.
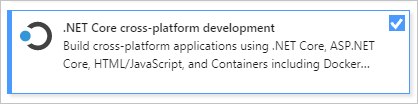
The modular installer enables you to choose and install workloads, which are groups of features needed for the programming language or platform you prefer. To follow the steps for creating a program, be sure to select the .NET Core cross-platform developmentworkload during installation.
When you start Visual Studio for the first time, you can optionally sign in using your Microsoft account, or your work or school account.
Tour of the IDE
To give you a high-level visual overview of Visual Studio, the following image shows Visual Studio with an open project and several key tool windows you’ll likely use:

-
Solution Explorer (top right) lets you view, navigate, and manage your code files. Solution Explorer can help organize your code by grouping the files into solutions and projects.
-
The editor window (center), where you’ll likely spend a majority of your time, displays file contents. This is where you can edit code or design a user interface such as a window with buttons and text boxes.
-
The Output window (bottom center) is where Visual Studio sends notifications such as debugging and error messages, compiler warnings, publishing status messages, and more. Each message source has its own tab.
-
Team Explorer (bottom right) lets you track work items and share code with others using version control technologies such as Git and Team Foundation Version Control (TFVC).
Popular productivity features
Some of the popular features in Visual Studio that help you to be more productive as you develop software include:
-
Refactoring includes operations such as intelligent renaming of variables, extracting one or more lines of code into a new method, changing the order of method parameters, and more.

-
IntelliSense is a term for a set of features that displays information about your code directly in the editor and, in some cases, write small bits of code for you. It’s like having basic documentation inline in the editor, which saves you from having to look up type information elsewhere. IntelliSense features vary by language. For more information, see C# IntelliSense, Visual C++ IntelliSense, JavaScript IntelliSense, and Visual Basic IntelliSense. The following illustration shows how IntelliSense displays a member list for a type:

-
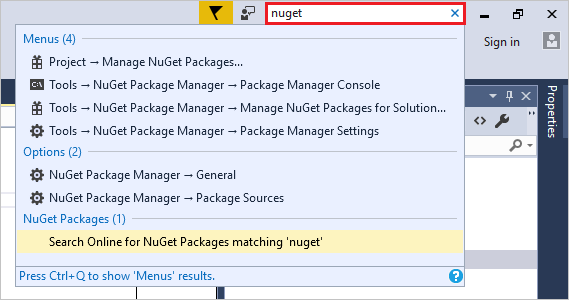
Visual Studio can seem overwhelming at times with so many menus, options, and properties. The Quick Launch search box is a great way to rapidly find what you need in Visual Studio. When you start typing the name of something you’re looking for, Visual Studio lists results that take you exactly where you need to go. If you need to add functionality to Visual Studio, for example to add support for an additional programming language, Quick Launch provides results that open Visual Studio Installer to install a workload or individual component.
-
Squiggles and Quick ActionsSquiggles are wavy underlines that alert you to errors or potential problems in your code as you type. These visual clues enable you to fix problems immediately without waiting for the error to be discovered during build or when you run the program. If you hover over a squiggle, you see additional information about the error. A light bulb may also appear in the left margin with actions, known as Quick Actions, to fix the error.

-
The Call Hierarchy window shows the methods that call a selected method. This can be useful information when you’re thinking about changing or removing the method, or when you’re trying to track down a bug.

-
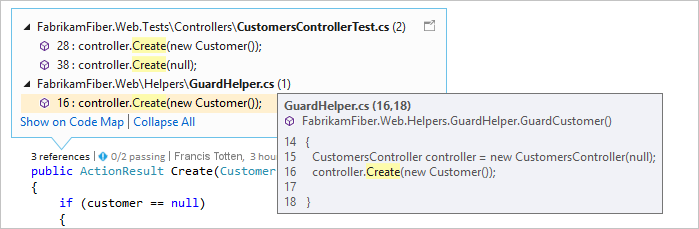
CodeLens helps you find references to your code, changes to your code, linked bugs, work items, code reviews, and unit tests, all without leaving the editor.
-
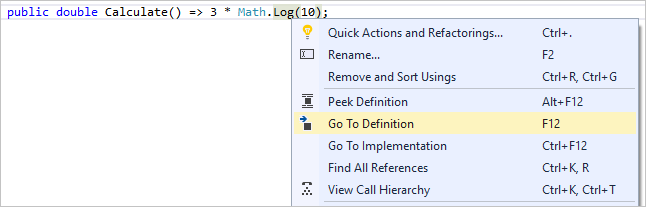
The Go To Definition feature takes you directly to the location where a function or type is defined.
-
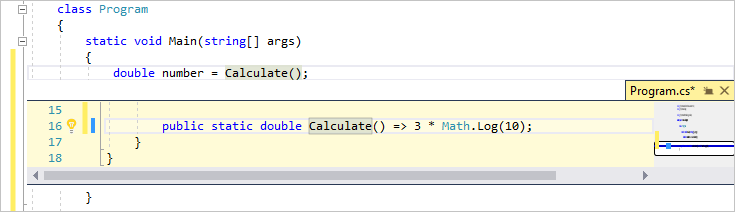
The Peek Definition window shows the definition of a method or type without actually opening a separate file.
Create a program
Let’s dive in and create a new, simple program.
-
Open Visual Studio. On the menu, choose File > New > Project.
New Project on menu bar” data-linktype=”relative-path” src=”https://docs.microsoft.com/en-us/visualstudio/ide/media/file-new-project-menu.png?view=vs-2017″ style=”border: 0px; box-sizing: inherit; display: inline-block; height: auto; max-width: 100%;” />
-
The New Project dialog box shows several project templates. A template contains the basic files and settings needed for a given project type. Choose the .NET Core category under Visual C#, and then choose the Console App (.NET Core) template. In the Nametext box, type HelloWorld, and then select the OK button.
 Visual Studio creates the project. It’s a simple “Hello World” application that calls the Console.WriteLine() method to display the literal string “Hello World!” in the console (program output) window.NoteIf you don’t see the .NET Core category, you need to install the .NET Core cross-platform development workload. To do this, choose the Open Visual Studio Installer link on the bottom left of the New Project dialog. After Visual Studio Installer opens, scroll down and select the .NET Core cross-platform developmentworkload, and then select Modify.Shortly, you should see something like the following:
 The C# code for your application shows in the editor window, which takes up most of the space. Notice that the text is automatically colorized to indicate different parts of the code, such as keywords and types. In addition, small, vertical dashed lines in the code indicate which braces match one another, and line numbers help you locate code later. You can choose the small, boxed minus signs to collapse or expand blocks of code. This code outlining feature lets you hide code you don’t need, helping to minimize onscreen clutter. The project files are listed on the right side in a window called Solution Explorer.
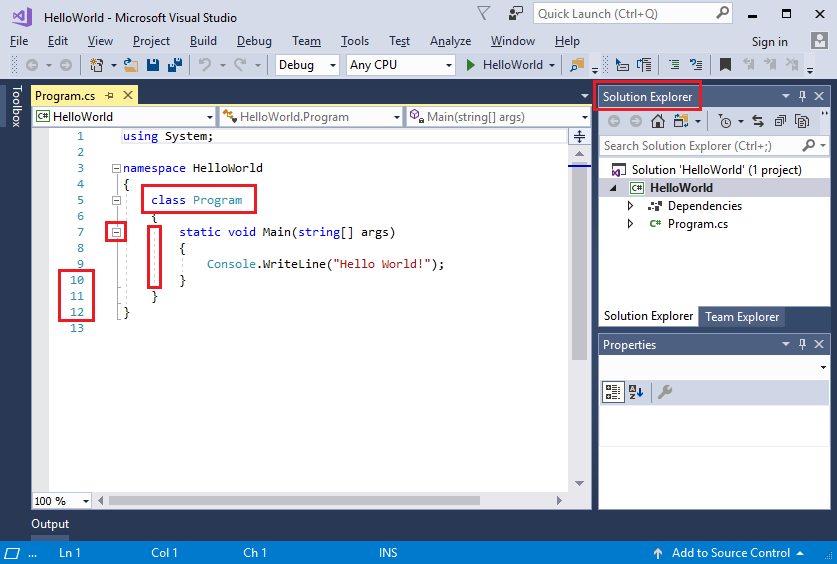 There are other menus and tool windows available, but let’s move on for now.
 -
Now, start the app. You can do this by choosing Start Without Debugging from the Debug menu on the menu bar. You can also press Ctrl+F5.
Start without debugging menu” data-linktype=”relative-path” src=”https://docs.microsoft.com/en-us/visualstudio/ide/media/overview-start-without-debugging.png?view=vs-2017″ style=”border: 0px; box-sizing: inherit; display: inline-block; height: auto; max-width: 100%;” />
Visual Studio builds the app, and a console window opens with the message Hello World!. You now have a running app!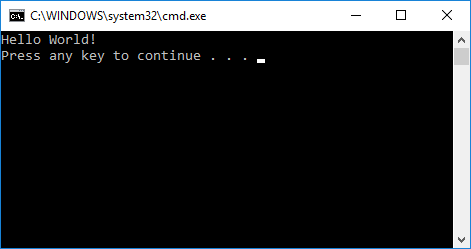
-
To close the console window, press any key on your keyboard.
-
Let’s add some additional code to the app. Add the following C# code before the line that says
Console.WriteLine("Hello World!");:C#CopyConsole.WriteLine("\nWhat is your name?");
var name = Console.ReadLine();This code displays What is your name? in the console window, and then waits until the user enters some text followed by the Enter key. -
Change the line that says
Console.WriteLine("Hello World!");to the following code:C#CopyConsole.WriteLine($"\nHello {name}!"); -
Run the app again by selecting Debug > Start Without Debugging or by pressing Ctrl+F5.Visual Studio rebuilds the app, and a console window opens and prompts you for your name.
-
Enter your name in the console window and press Enter.

-
Press any key to close the console window and stop the running program.
Use refactoring and IntelliSense
Let’s look at a couple of the ways that refactoring and IntelliSense can help you code more efficiently.
First, let’s rename the
name variable:-
Double-click the
namevariable to select it. -
Type in the new name for the variable, username.Notice that a gray box appears around the variable, and a light bulb appears in the margin.
-
Select the light bulb icon to show the available Quick Actions. Select Rename ‘name’ to ‘username’.
 The variable is renamed across the project, which in our case is only two places.
-
Now let’s take a look at IntelliSense. Below the line that says
Console.WriteLine($"\nHello {username}!");, type DateTime now = DateTime..A box displays the members of the DateTime class. In addition, the description of the currently selected member displays in a separate box. -
Select the member named Now, which is a property of the class, by double-clicking on it or pressing Tab. Complete the line of code by adding a semi-colon ;.
-
Below that, type in or copy the following lines of code:C#Copy
int dayOfYear = now.DayOfYear;

Console.Write("Day of year: ");
Console.WriteLine(dayOfYear);TipConsole.Write is a little different to Console.WriteLine in that it doesn’t add a line terminator after it prints. That means that the next piece of text that’s sent to the output will print on the same line. You can hover over each of these methods in your code to see their description. -
Next, we’ll use refactoring again to make the code a little more concise. Click on the variable
nowin the lineDateTime now = DateTime.Now;.Notice that a little screwdriver icon appears in the margin on that line. -
Click the screwdriver icon to see what suggestions Visual Studio has available. In this case, it’s showing the Inline temporary variable refactoring to remove a line of code without changing the overall behavior:

-
Click Inline temporary variable to refactor the code.
-
Run the program again by pressing Ctrl+F5. The output looks something like this:

Debug code
When you write code, you need to run it and test it for bugs. Visual Studio’s debugging system lets you step through code one statement at a time and inspect variables as you go. You can set breakpoints that stop execution of the code at a particular line. You can observe how the value of a variable changes as the code runs, and more.
Let’s set a breakpoint to see the value of the
username variable while the program is “in flight”.-
Find the line of code that says
Console.WriteLine($"\nHello {username}!");. To set a breakpoint on this line of code, that is, to make the program pause execution at this line, click in the far left margin of the editor. You can also click anywhere on the line of code and then press F9.A red circle appears in the far left margin, and the code is highlighted in red.
-
Start debugging by selecting Debug > Start Debugging or by pressing F5.
-
When the console window appears and asks for your name, type it in and press Enter.Notice that the focus returns to the Visual Studio code editor and the line of code with the breakpoint is highlighted in yellow. This signifies that it’s the next line of code that the program will execute.
-
Hover your mouse over the
usernamevariable to see its value. Alternatively, you can right-click onusernameand select Add Watch to add the variable to the Watchwindow, where you can also see its value.
-
To let the program run to completion, press F5 again.
To get more details about debugging in Visual Studio, see Debugger feature tour.
