How to find second highest value in table ?

 How to find second highest value in table ?

 SQL Server 
Find the highest employee salary   

SELECT EmpId, Salary
FROM(
Select EmpId, Salary, ROW_NUMBER() OVER(ORDER BY Salary Desc) AS Salary_Order
FROM   Employee
) results
WHERE results. Salary_Order = 1 ;

Find the 2nd highest employee salary   

SELECT EmpId, Salary
FROM(
Select EmpId, Salary, ROW_NUMBER() OVER(ORDER BY Salary Desc) AS Salary_Order
FROM   Employee
) results
WHERE results. Salary_Order = 2 ;

Find the 3rd highest employee salary   

SELECT EmpId, Salary
FROM(
Select EmpId, Salary, ROW_NUMBER() OVER(ORDER BY Salary Desc) AS Salary_Order
FROM   Employee
) results
WHERE results. Salary_Order = 3 ;

  
MySQL Server 
Type 1 : Find the 2nd highest employee salary  

SELECT MAX(salary) 
FROM Employee 
WHERE salary NOT IN ( SELECT Max(salary) FROM Employee);

Type 2 : Find the 2nd highest employee salary  

SELECT MAX(salary) 
From Employee 
WHERE salary < ( SELECT Max(salary) FROM Employee);

Type 3 : Find the 2nd highest employee salary  


SELECT salary 
FROM (
             SELECT salary FROM Employee ORDER BY salary DESC LIMIT 2
       ) AS Emp ORDER BY salary LIMIT 1;

SOLVED Could not load file or assembly ‘Renci.SshNet – MySQL

Solved Could not load file or assembly ‘Renci.SshNet, Version=2016.1.0.0, Culture=neutral, PublicKeyToken=1cee9f8bde3db106’ or one of its dependencies ?

The Solution is right below 

Working with MySQL database, have you realized all the while the MySql connection is lost for no reason? 

Now you go to visual studio project libraries you will find MySQL client dll still available but initiating the connection.open(), compiler throws an exception below. MySQL client is missing its dependencies.

Could not load file or assembly ‘Renci.SshNet, Version=2016.1.0.0, Culture=neutral, PublicKeyToken=1cee9f8bde3db106’ or one of its dependencies. The system cannot find the file specified.


If you are reading this line, great you spot the right solution.

Step by Step
  1. Go to your Visual Studio Project Solution Explorer
  2. Right click on the References
  3. Click on Mange NuGet Packet References and click Browse 
  4. Search for “Renci.SshNet.Async”
  5. Install and rebuild the solution
  6. Now, try to initiate MySQL Database connection will be successful.

How to change the height of header in DataGridView ?

How to change the height of header in DataGridView ?

All developers might have gone through changing the data grid view header size to increase.  You add data grid view control to windows form and press F7 and go to designer view or else go to your code behind  file and add the below code snippet.
  Tip
 // Set grid column header styles.

 this.dGridCompanies.ColumnHeadersHeightSizeMode = DataGridViewColumnHeadersHeightSizeMode.EnableResizing;
        this.dGridCompanies.ColumnHeadersHeight = 60;
            this.dGridCompanies.ColumnHeadersHeightSizeMode = DataGridViewColumnHeadersHeightSizeMode.DisableResizing;

 Below the are the results when you make change on the grid header column size to 60.
OUTPUT 

Publishing an existing project to GitHub

    Publishing an existing project to GitHub

    1. Open a solution in Visual Studio.
    2. If solution is not already initialized as a Git repository, select Add to Source Control from the File menu. Location of Add to Source Control option in the file menu
    3. Open Team ExplorerLocation of Team Explorer option in the view menu
    4. In Team Explorer, click SyncLocation of the sync button in the Team Explorer pane
    5. Click the Publish to GitHub button. Location of the Publish to GitHub button in the Team Explorer pane
    6. Enter a name and description for the repository on GitHub.
    7. Check the Private Repository box if you want to upload the repository as a private repository on GitHub.
    8. Click the Publish button.

    .NET Core 3.0 will launch at .NET Conf 2019 Sep 23- 25


    .NET Conf 2019 is only a few days away! We will be live streaming September 23-25 on www.dotnetconf.netThis year .NET Core 3.0 will launch at .NET Conf 2019! We’ve been hard at work organizing more than 75 sessions, including an amazing keynote, that will kick off the show at 9:00 AM pacific (16:00 UTC).

    Check out the full schedule and speakers here!

    We’ll be taking questions live so be sure to watch the stream in real-time and ask your questions on Twitter via the #dotNETConf hash tag. We’ll have in-studio hosts including Scott Hanselman this year asking the questions and showing the fun things happening on Twitter.

    Our partners are also hosting two virtual attendee parties and a technical treasure hunt where you can win prizes by answering .NET trivia questions and solving technical challenges. We just added the details on how to participate and win some really awesome prizes. Good luck!

    Win prizes from our partners!

    We’ve also partnered with organizers around the globe, including our .NET Foundation meetup groups, to pull together local in-person events and watch parties between September 23 through end of October. There are now over 200 events worldwide! Join your fellow developers in a city near you to learn more about .NET and have fun together.

    Attend a local event!

    You can also watch #dotNETConf on Twitter to join the conversation, and show off your support for .NET. You might end up on our live stream broadcast. See you there! www.dotnetconf.net

    Timeout expired. The timeout period elapsed prior to completion of the operation or the server is not responding.

    How to fix Timeout expired. The timeout period elapsed prior to completion of the operation or the server is not responding

    Finding Root Cause:

    When using MySQL  database and  .NET /Connector with a thousands of rows to do an INSERT IGNORE command results in timeout expired exception. Usually we tend to suspect on the connection time out or command timeout variable. 
    But in this case, the problem is with  net_read_timeout, because the command needs to read thousands of rows before to do the task, the MySQL database net_read_timeout variable default value might be less than the expected value.
    The best way to fix it, is to increase the net_read_timeout (by default is only 30 seconds see mysql website) so, you allow the command sufficient seconds to read. If not, the connection will close, because net_read takes more time than the timeout settled.

    Before:

    Solution:

     You need to have administration permissions to change global variables: 
    1.  Open MySQL query browser or MySQL console 
    2.  Run this command   SET GLOBAL   net_read_timeout = 100;

    After:

    What’s new in Visual Studio 2019

    What’s new in Visual Studio 2019


    With Visual Studio 2019, you’ll get best-in-class tools and services for any developer, any app, and any platform. Whether you’re using Visual Studio for the first time or you’ve been using it for years, there’s a lot to like in this new version!
    Here’s a high-level recap of what’s new:
    • Develop: Stay focused and productive with improved performance, instant code cleanup, and better search results.
    • Collaborate: Enjoy natural collaboration through a Git-first workflow, real-time editing and debugging, and code reviews right in Visual Studio.
    • Debug: Highlight and navigate to specific values, optimize memory use, and take automatic snapshots of your application’s execution.
    For a complete list of everything that’s new in this version, see the release notes.

    Develop

    View the following video to learn more about how you can save time with new features.

    Video length: 3.00 minutes
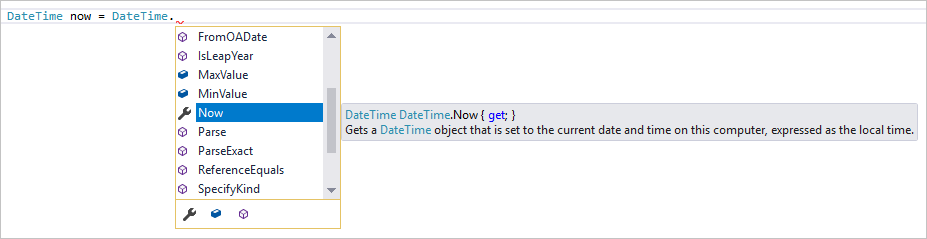
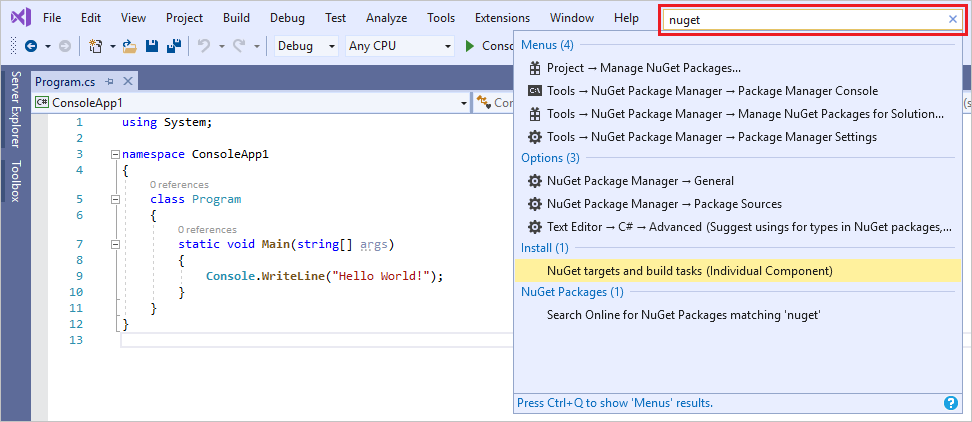
    Formerly known as Quick Launch, our new search experience is faster and more effective. Now, search results appear dynamically as you type. And, search results can often include keyboard shortcuts for commands, so that you can more easily memorize them for future use.
    An animation of the new search experience in Visual Studio 2019
    The new fuzzy search logic will find anything you need, regardless of typos. So, whether you’re looking for commands, settings, documentation, or other useful things, the new search feature makes it easier to find what you’re looking for.
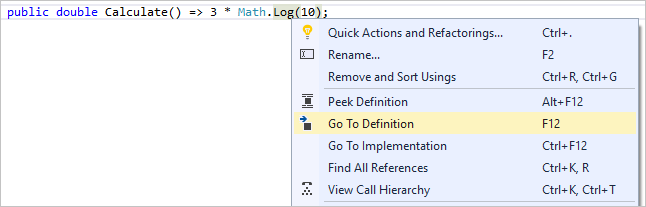
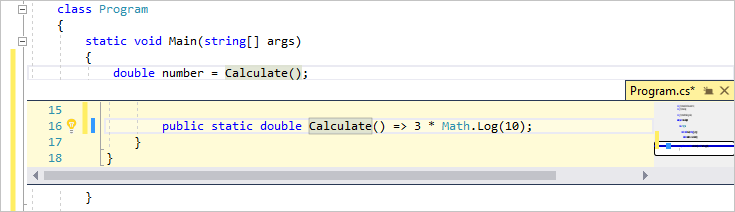
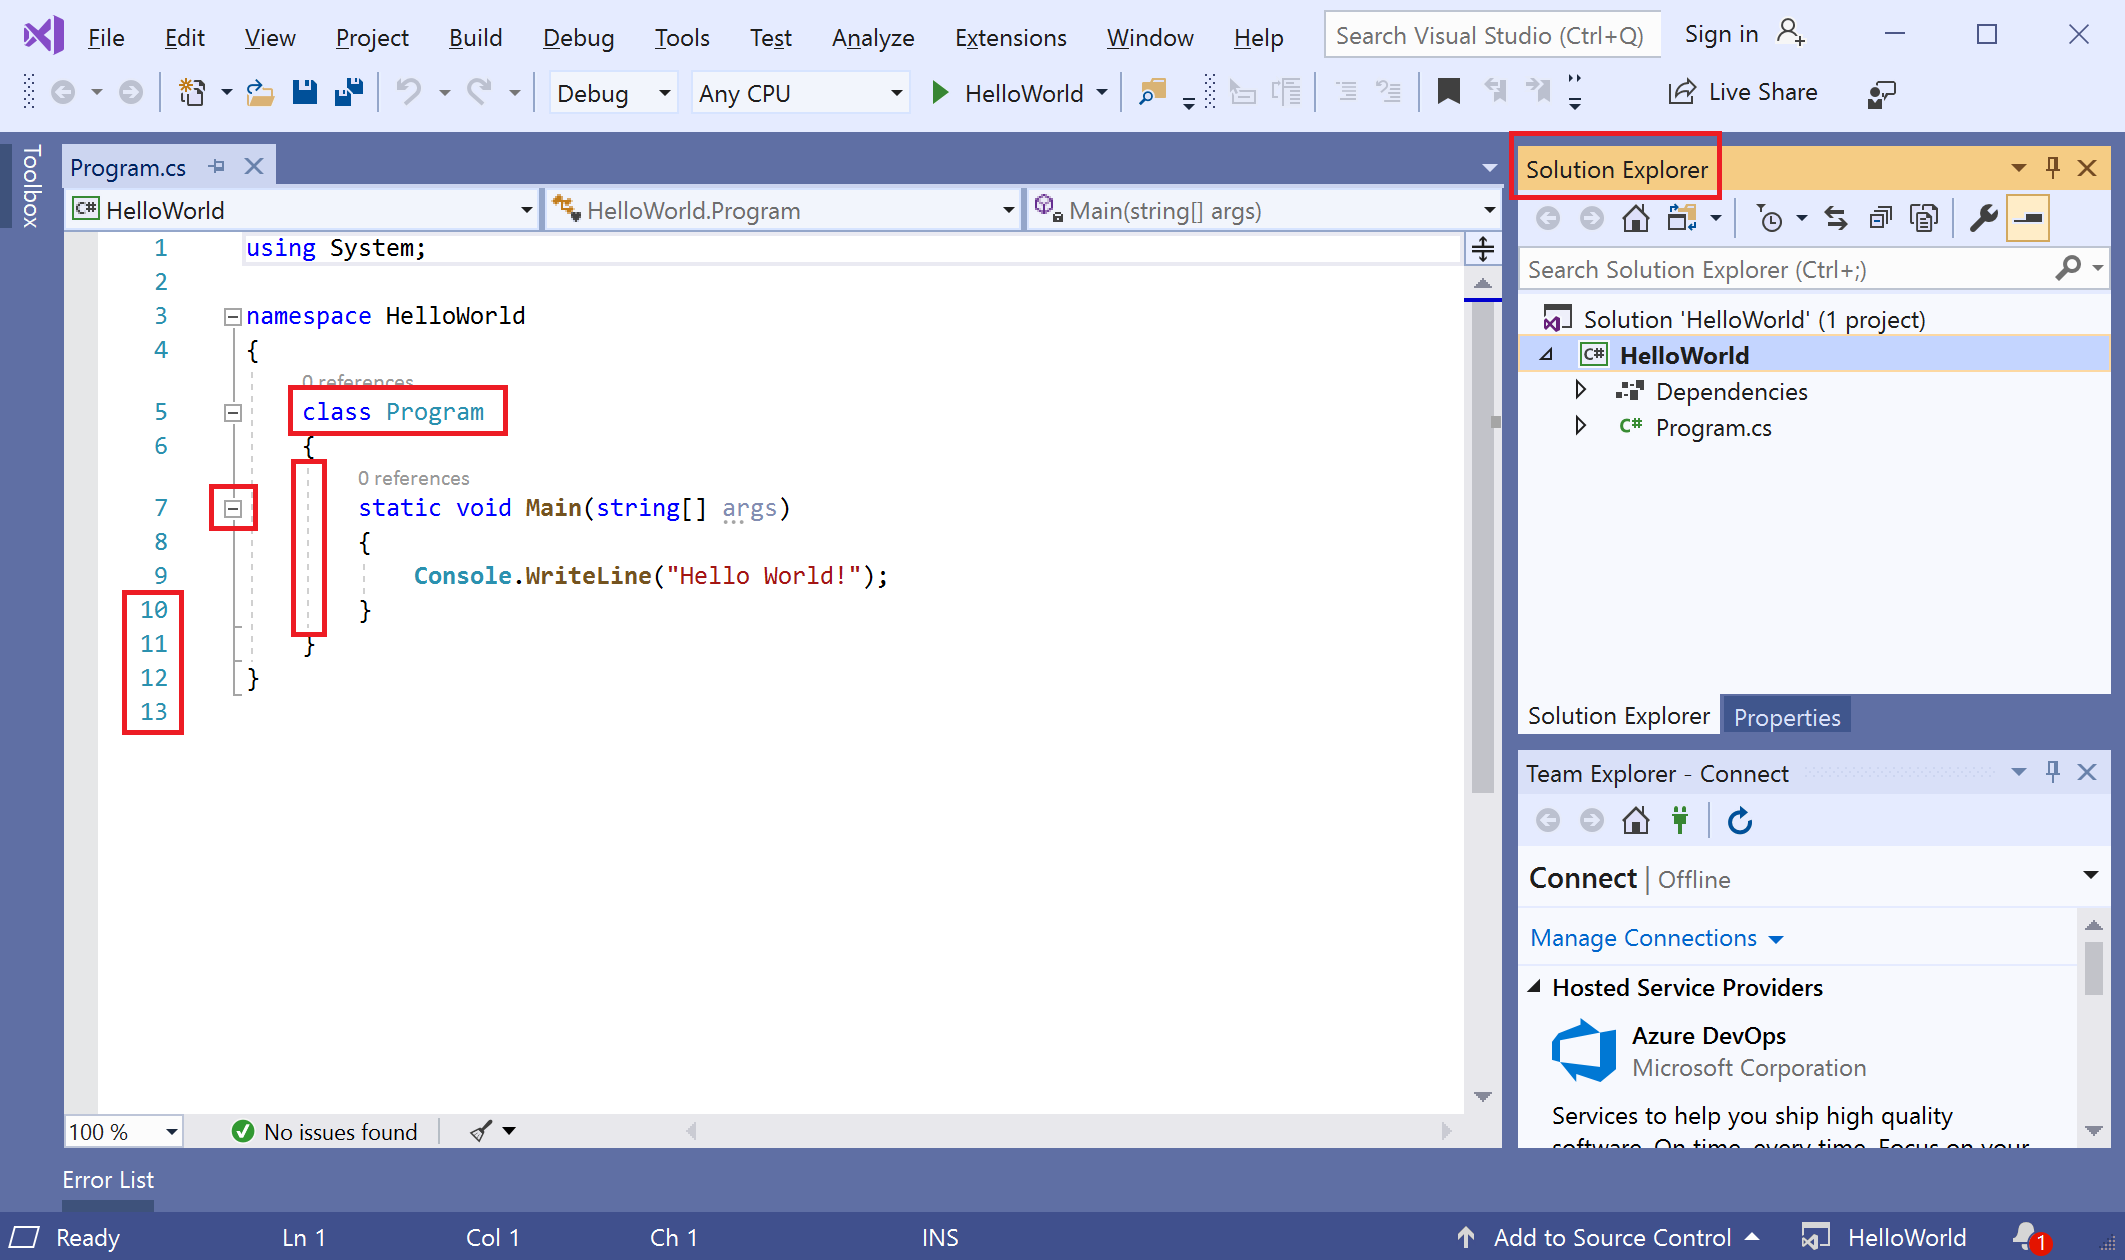
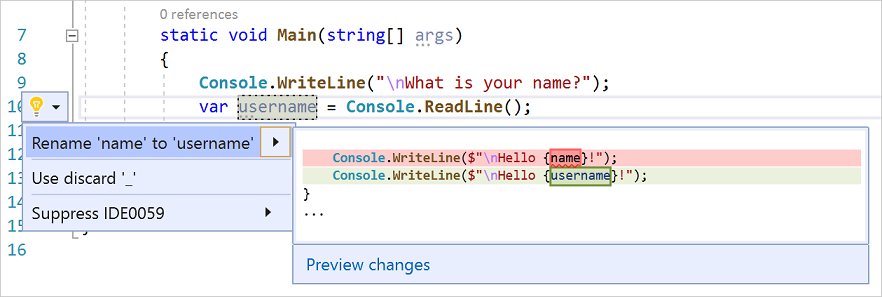
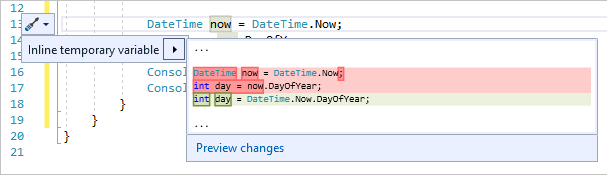
    Refactorings

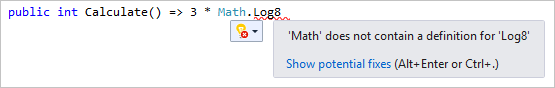
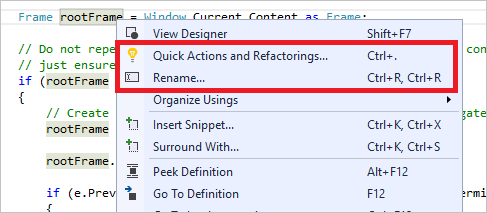
    There are lots of new and highly useful refactorings in C# that make it easier to organize your code. They show up as suggestions in the light bulb and include actions such as moving members to interface or base class, adjusting namespaces to match folder structure, convert foreach-loops to Linq queries, and more.
    An animation of the refactorings experience in Visual Studio 2019
    Simply invoke the refactorings by pressing Ctrl+. and selecting the action you want to take.

    IntelliCode

    Visual Studio IntelliCode enhances your software development efforts by using artificial intelligence (AI). IntelliCode trains across 2,000 open-source projects on GitHub—each with over 100 stars—to generate its recommendations.
    An animation of IntelliCode in Visual Studio 2019
    Here are a few ways that Visual Studio IntelliCode can help enhance your productivity:
    • Deliver context-aware code completions
    • Guide developers to adhere to the patterns and styles of their team
    • Find difficult-to-catch code issues
    • Focus code reviews by drawing attention to areas that really matter
    We initially supported only C# when we first previewed the IntelliCode as an extension for Visual Studio. Now, new in 16.1, we’ve added support for C# and XAML “in-the-box”. (Support for C++ and TypeScript/JavaScript are still in preview, however.)
    And if you’re using C#, we’ve also added the ability to train a custom model on your own code.

    Code cleanup

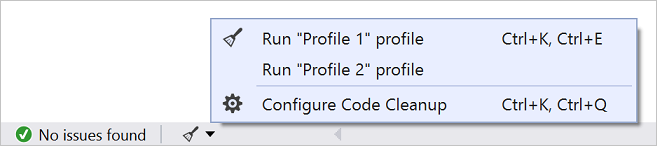
    Paired with a new document health indicator is a new code cleanup command. You can use this new command to identify and then fix both warnings and suggestions with the click of a button.
    The cleanup will format the code and apply any code fixes as suggested by the current settings and .editorconfig files.
    A screenshot of the new code cleanup control in Visual Studio 2019
    You can also save collections of fixers as a profile. For example, if you have a small set of targeted fixers that you apply frequently while you code, and then you have another comprehensive set of fixers to apply before a code review, you can configure profiles to address these different tasks.
    A screenshot of the configure code cleanup control in Visual Studio 2019

    Per-monitor aware (PMA) rendering

    If you use monitors that are configured with different display scale factors, or connect remotely to a machine with display scale factors that are different from your main device, you might notice that Visual Studio looks blurry or renders at the wrong scale.
    With the release of Visual Studio 2019, we’re making Visual Studio a per-monitor aware (PMA) application. Now, Visual Studio renders correctly regardless of the display scale factors you use.
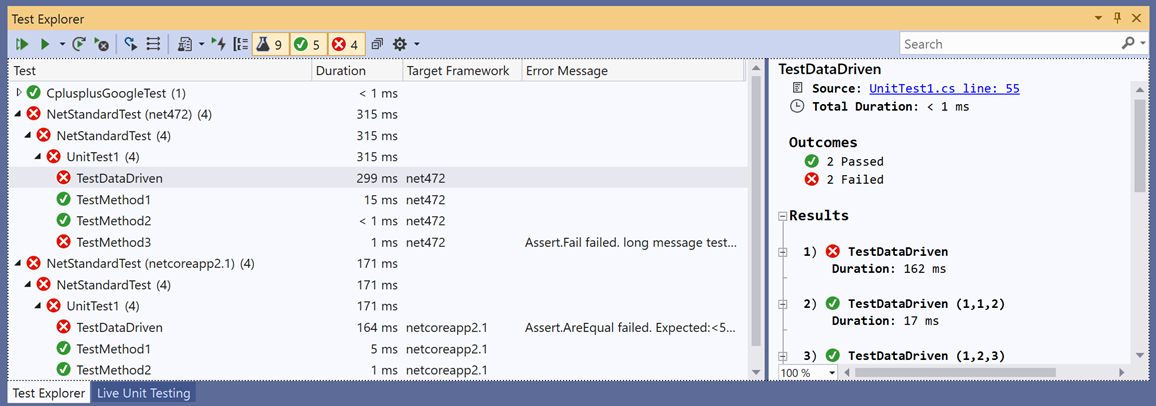
    Per-monitor aware (PMA) rendering in Visual Studio 2019
    For more information, see the Better multi-monitor experience with Visual Studio 2019 blog post.

    Test Explorer

    New in 16.2: We’ve updated Test Explorer to provide better handling of large test sets, easier filtering, more discoverable commands, tabbed playlist views, and customizable columns that let you fine-tune what test information is displayed.
    A screenshot that shows the user interface improvements in the Test Explorer

    Collaborate

    View the following video to learn more about how you can team up to solve issues.

    Video length: 4.22 minutes

    Cloud-first workflow

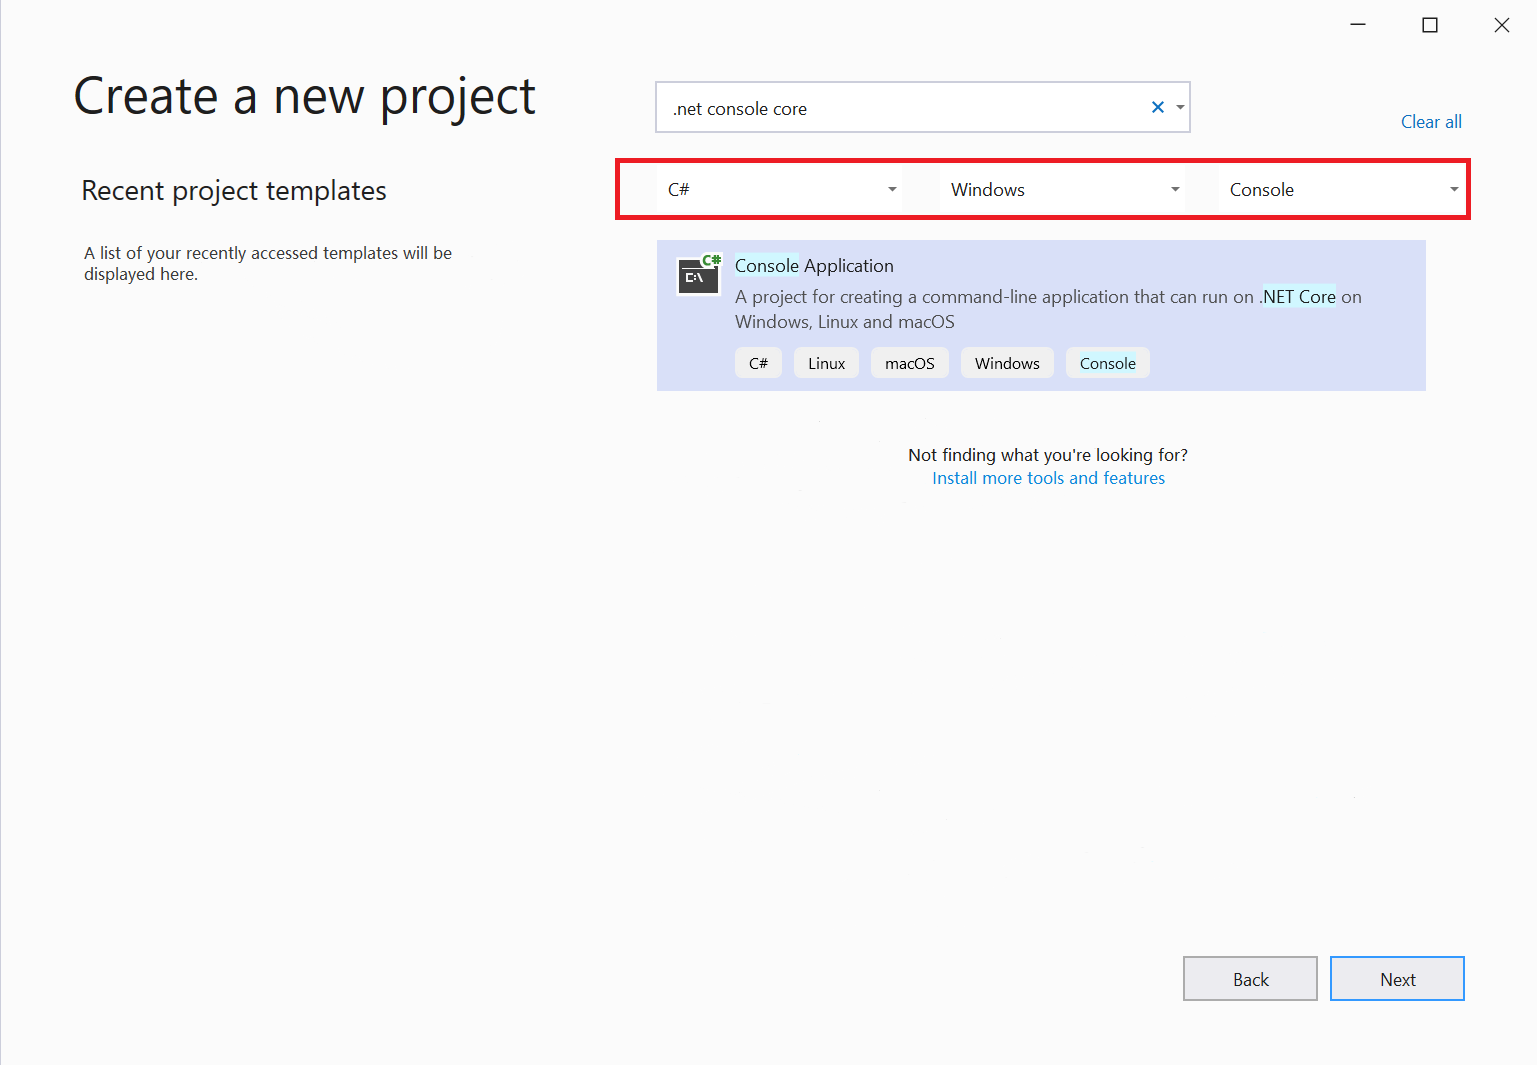
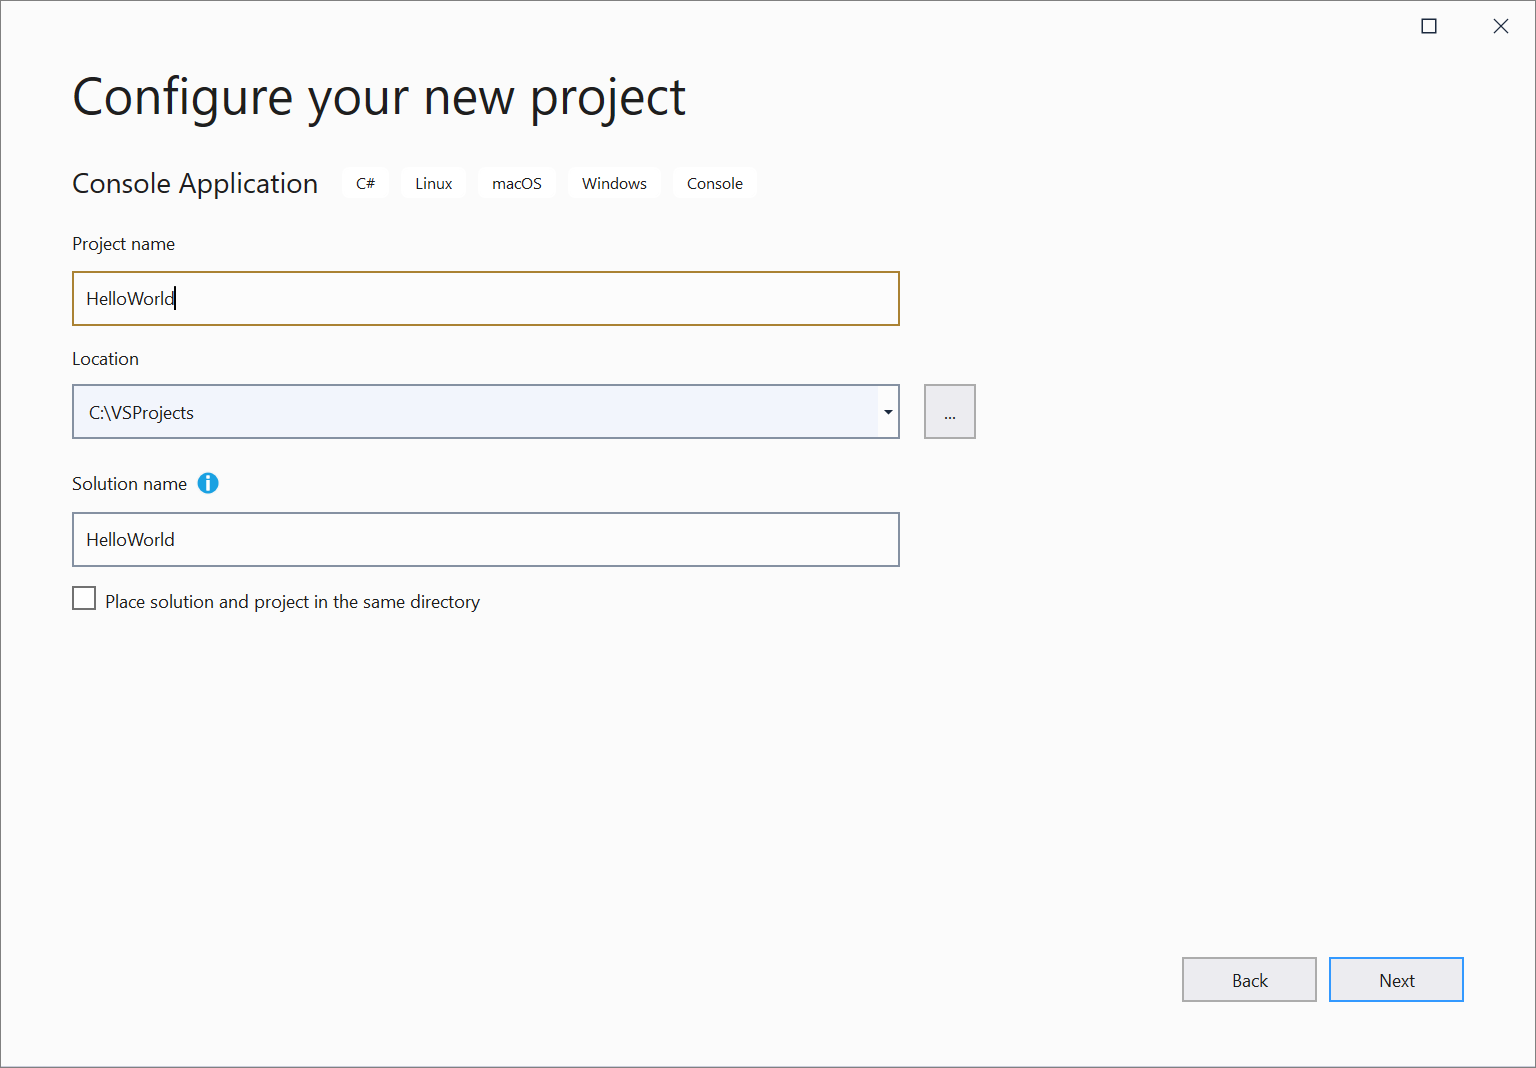
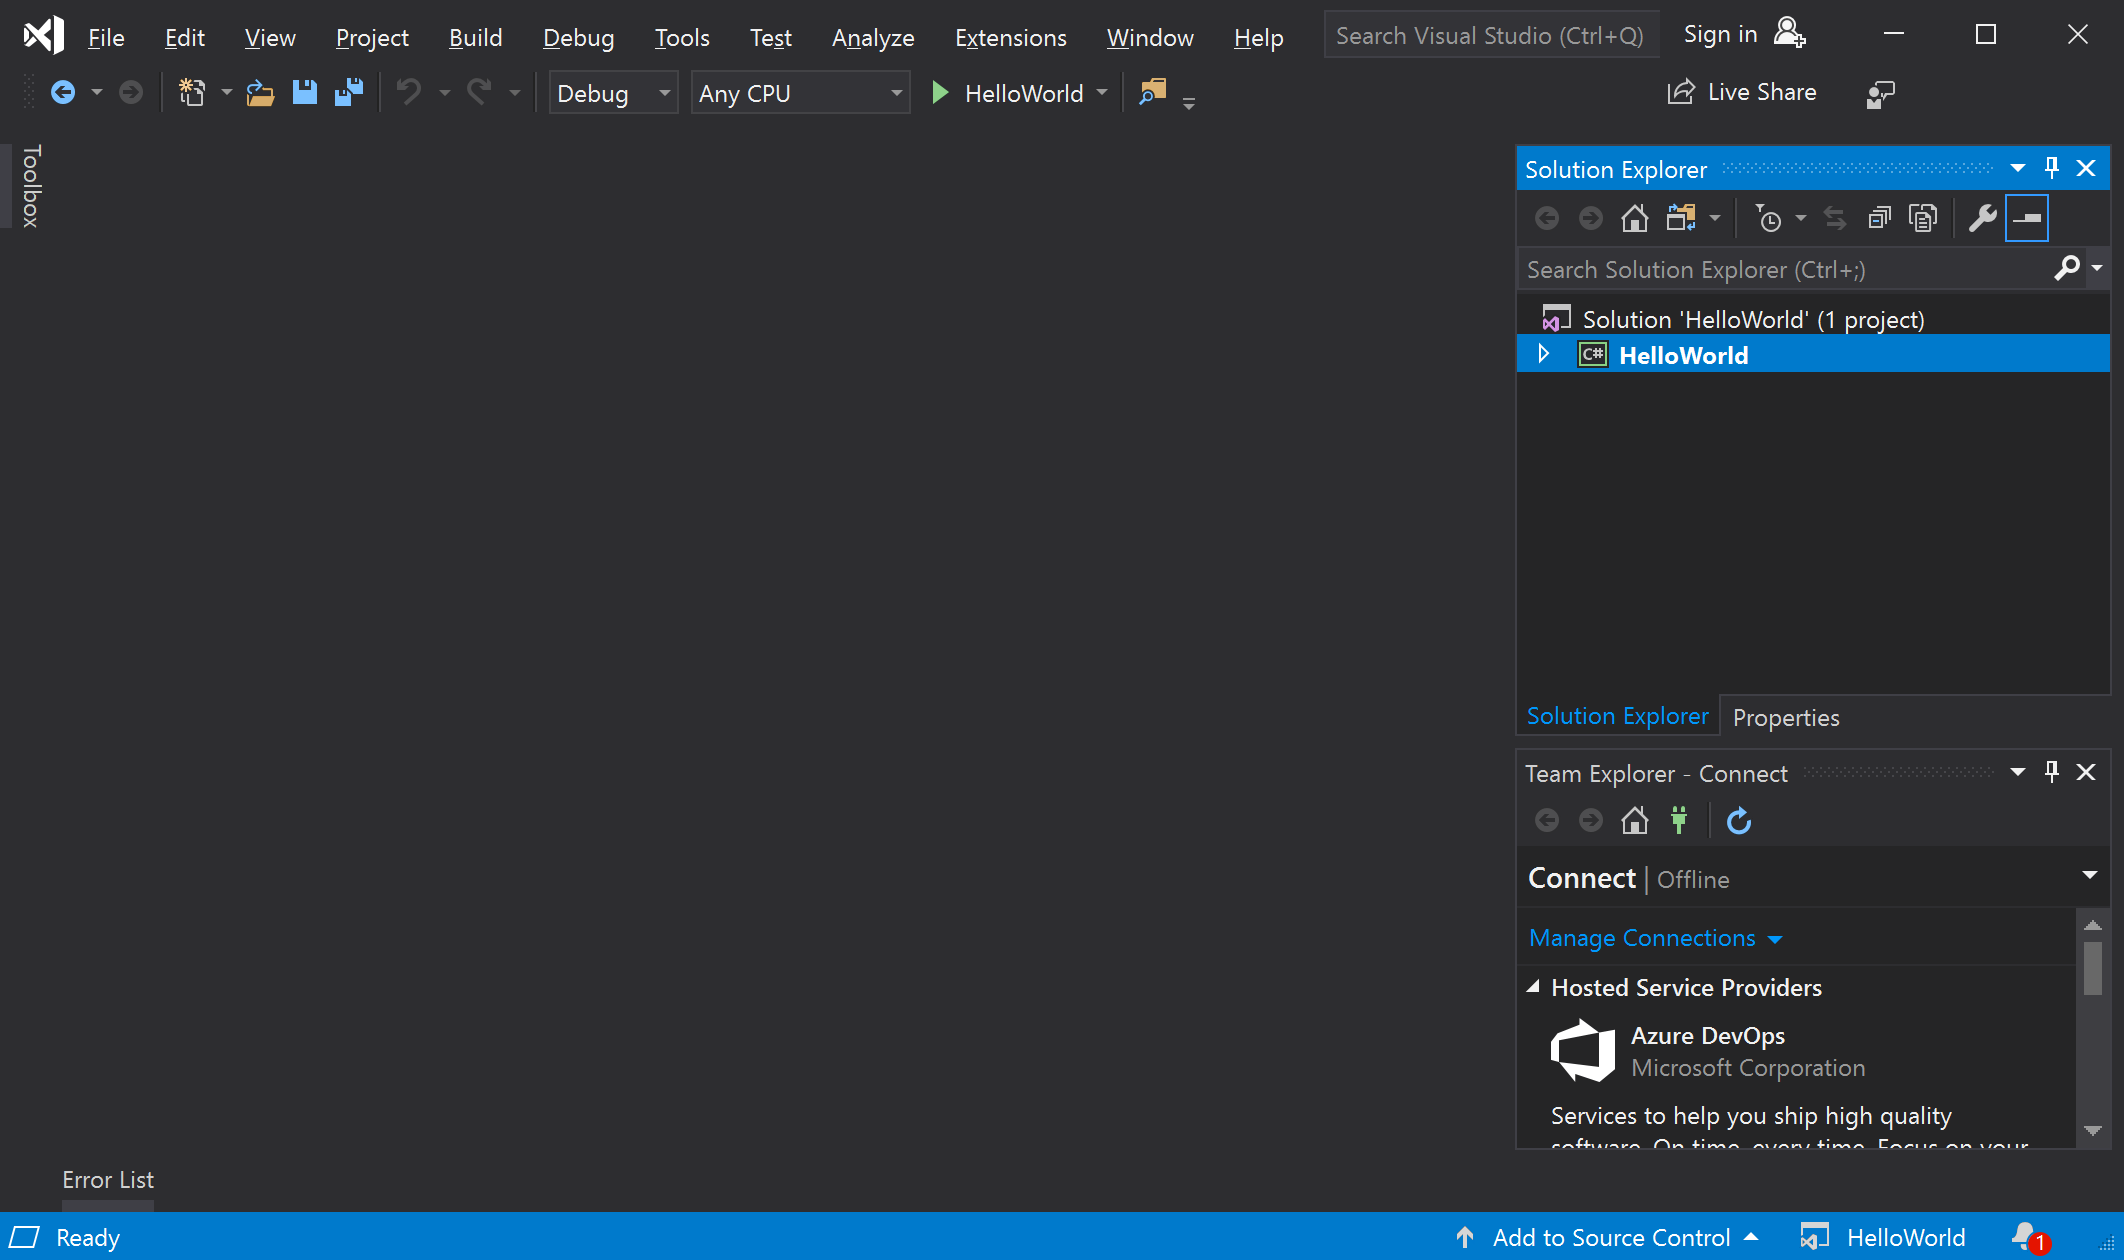
    Something you’ll notice when you open Visual Studio 2019 is its new start window.
    A screenshot of the new start window in Visual Studio 2019
    The start window presents you with several options to get you to code quickly. We’ve placed the option to clone or check out code from a repo, first.
    An animation of the 'Git-first' experience in Visual Studio 2019
    The start window also includes options to open a project or solution, open a local folder, or create a new project.
    For more information, see the Get to code: How we designed the new Visual Studio start window blog post.

    Live Share

    Visual Studio Live Share is a developer service that allows you to share a codebase and its context with a teammate and get instant bidirectional collaboration directly from within Visual Studio. With Live Share, a teammate can read, navigate, edit, and debug a project that you’ve shared with them, and do so seamlessly and securely.
    And with Visual Studio 2019, this service is installed by default.
    An animation that shows the Live Share collaboration feature in Visual Studio 2019

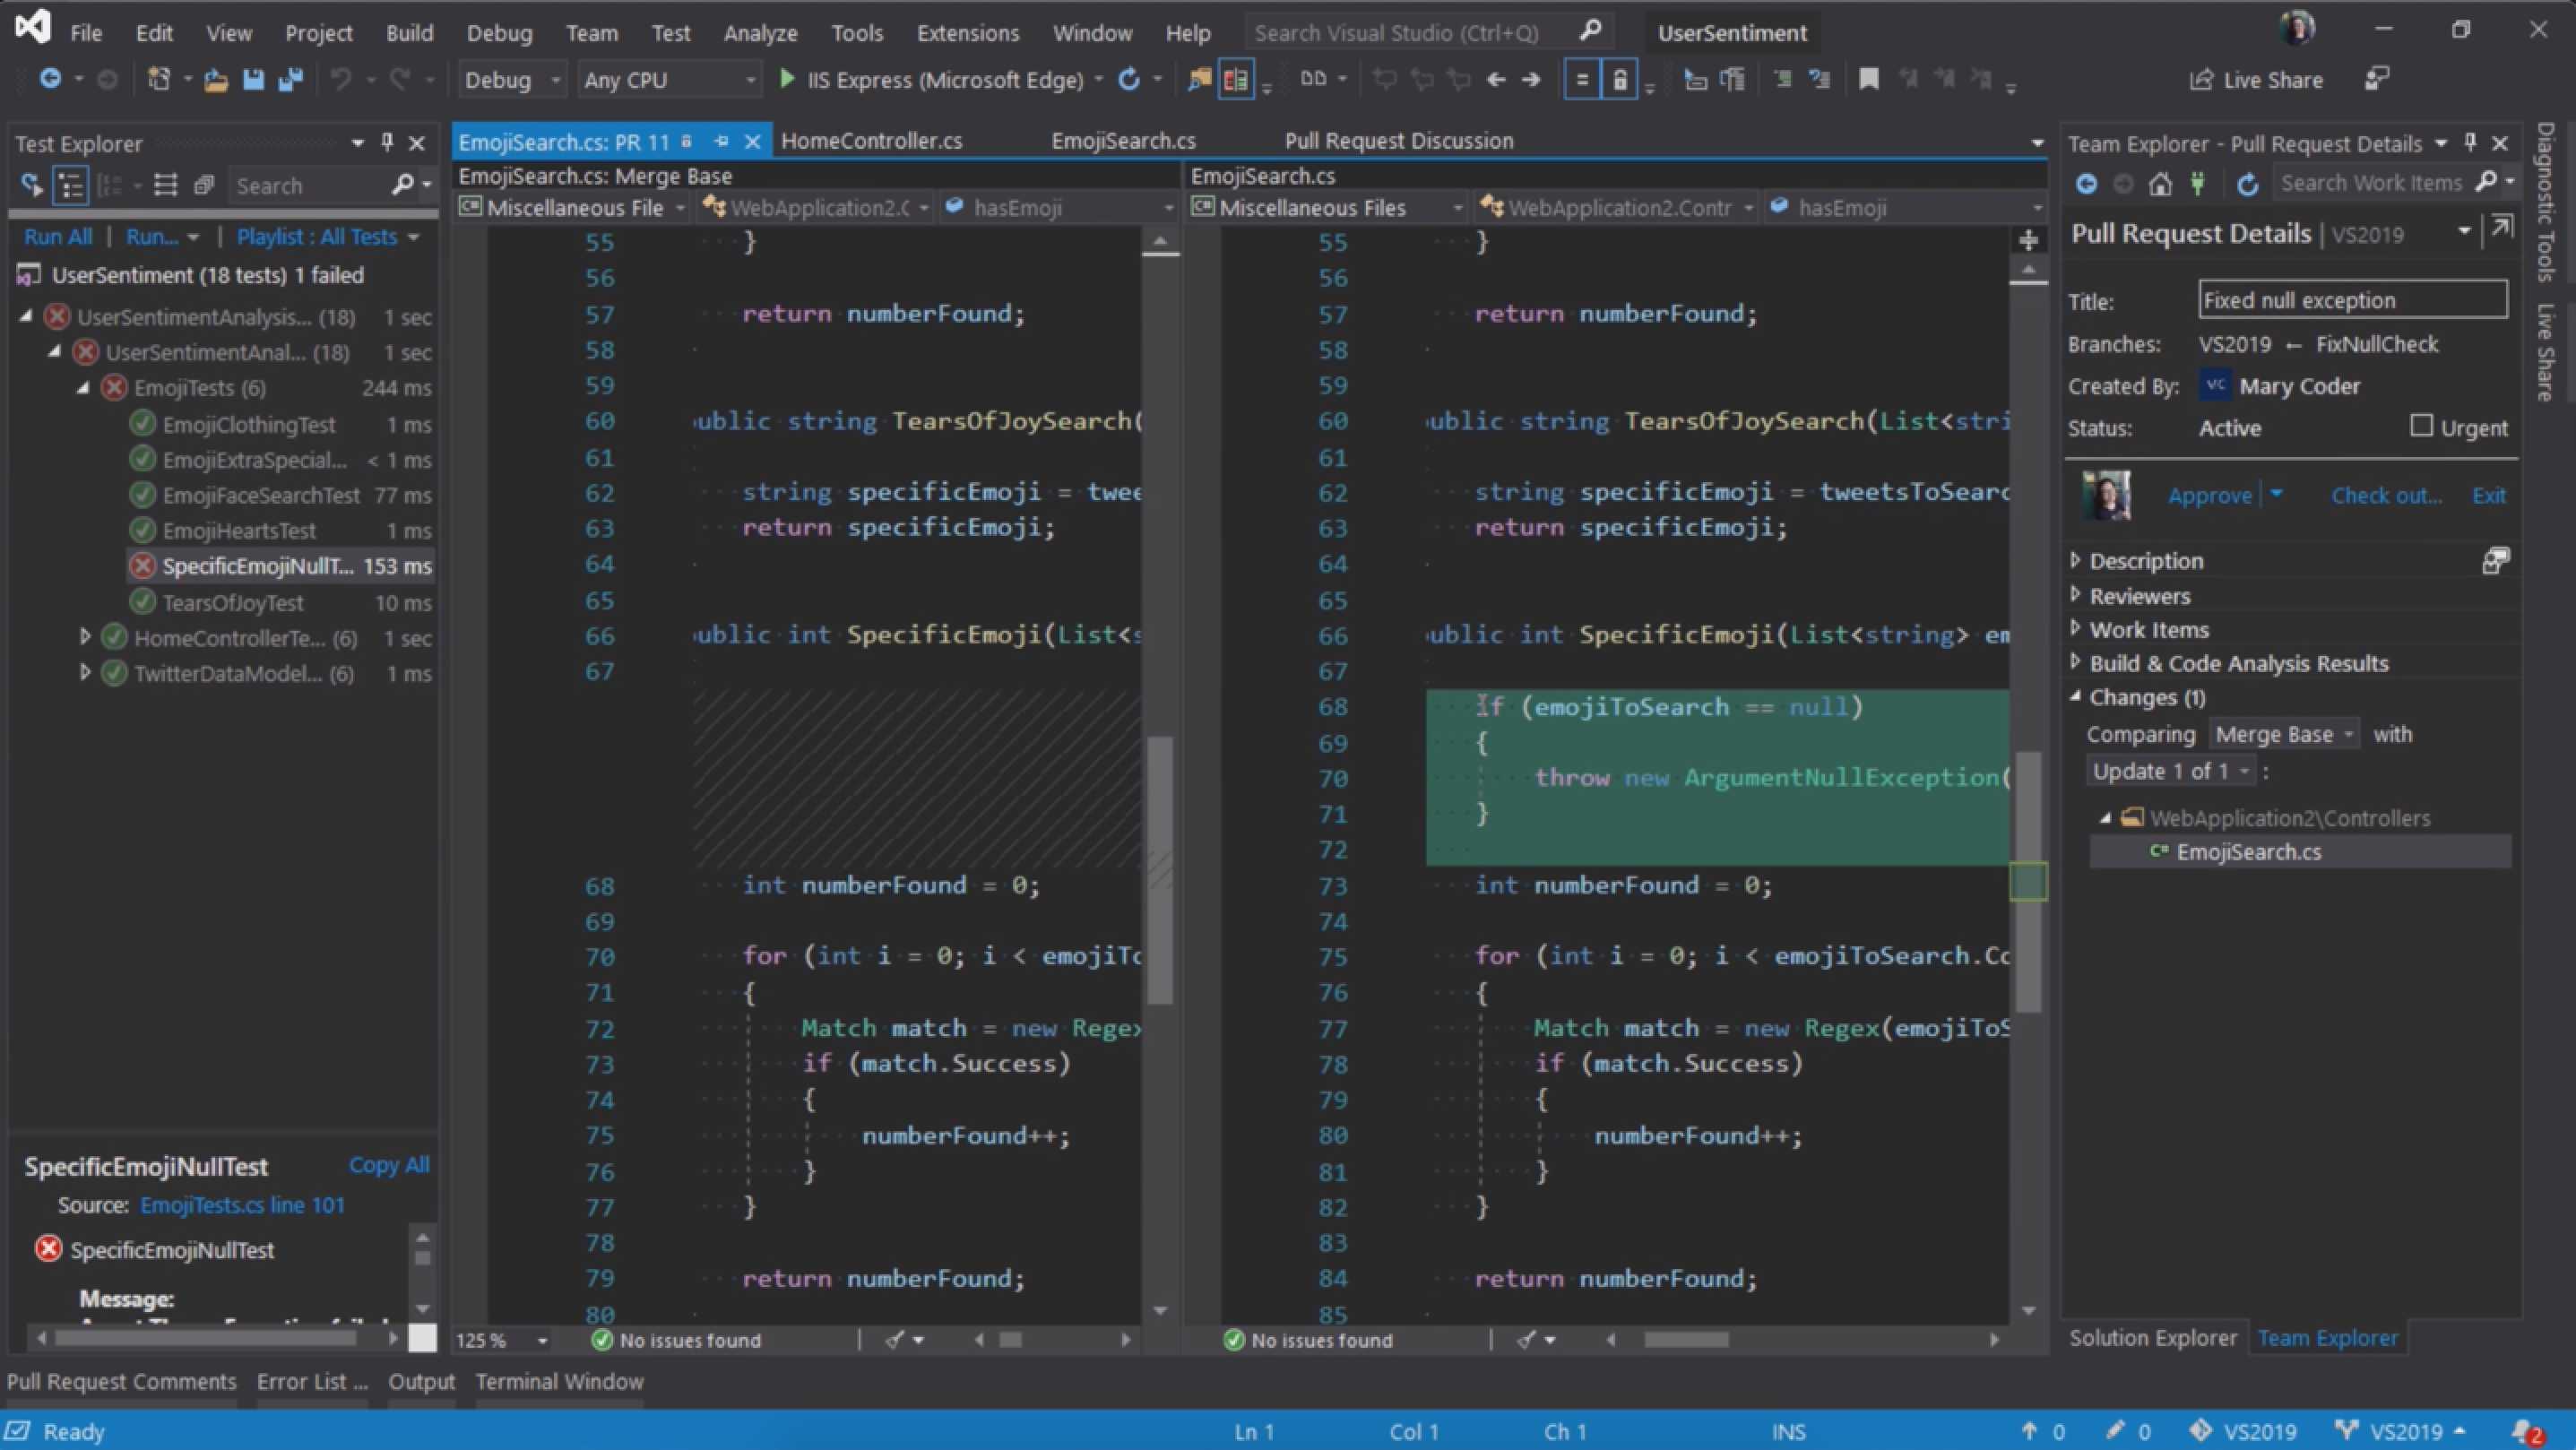
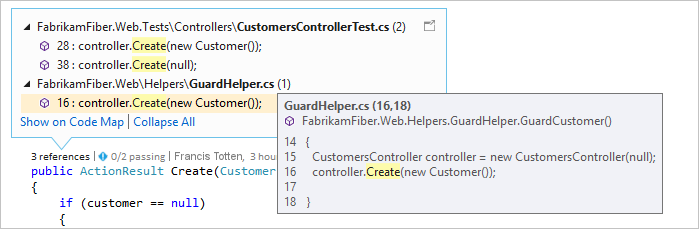
    Integrated code reviews

    We’re introducing a new extension that you can download to use with Visual Studio 2019. With this new extension, you can review, run, and even debug pull requests from your team without leaving Visual Studio. We support code in both GitHub and Azure DevOps repositories.
    A screenshot of the new start window in Visual Studio 2019
    For more information, see the Code reviews using the Visual Studio Pull Requests extensionblog post.

    Debug

    View the following video to learn more about how you can zero in with precise targeting while you debug.

    Video length: 3.54 minutes

    Performance gains

    We’ve taken the once-exclusive C++ data breakpoints and adapted them for .NET Core applications.
    An animation that shows the debug data breakpoints in Visual Studio 2019
    So whether you’re coding in C++ or .NET Core, data breakpoints can be a good alternative to just placing regular breakpoints. Data breakpoints are also great for scenarios such as finding where a global object is being modified or being added or removed from a list.
    And, if you’re a C++ developer who develops large applications, Visual Studio 2019 has made symbols out of proc, which allows you to debug those applications without experiencing memory-related issues.

    Search while debugging

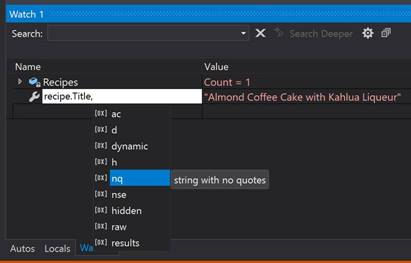
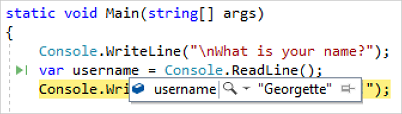
    You’ve probably been there before, looking in the Watch window for a string amongst a set of values. In Visual Studio 2019, we’ve added search in the Watch, Locals, and Autos windows to help you find the objects and values you’re looking for.
    An animation that shows the debug search window in Visual Studio 2019
    You can also format how a value is displayed within the Watch, Locals, and Autos windows. Double-click one of the items in any of the windows and add a comma (“,”) to access the drop-down list of possible format specifiers, each of which includes a description of its intended effect.
    The new Watch window and format values feature in Visual Studio 2019

    Snapshot Debugger

    Get a snapshot of your app’s execution in the cloud to see exactly what’s happening. (This feature is available in Visual Studio Enterprise, only.)
    An animation that shows the Snapshot Debugger in Visual Studio 2019 Enterprise
    We’ve added support for targeting ASP.NET (Core and desktop) applications that run on an Azure VM. And, we’ve added support for applications that run in an Azure Kubernetes Service. The Snapshot Debugger can help you dramatically reduce the time it takes to resolve issues that occur in production environments.

    Microsoft Edge Insider support

    New in 16.2: You can set a break point in a JavaScript application and start a debug session by using the Microsoft Edge Insider browser. When you do so, Visual Studio opens a new browser window with debugging enabled, which you can then use to step through application JavaScript within Visual Studio.
    A screenshot that shows JavaScript code rendering in a browser

    What’s next

    We update Visual Studio 2019 often with new features that can make your development experience even better. To learn more about our latest innovations, check out the Visual Studio Blog. And for a record of what we’ve released in preview to date, take a look at the Preview Release Notes.
    Want to know more about what else is in the works for Visual Studio 2019? See the Visual Studio Roadmap.

    Welcome to the Visual Studio IDE

    Welcome to the Visual Studio IDE


    The Visual Studio integrated development environment is a creative launching pad that you can use to edit, debug, and build code, and then publish an app. An integrated development environment (IDE) is a feature-rich program that can be used for many aspects of software development. Over and above the standard editor and debugger that most IDEs provide, Visual Studio includes compilers, code completion tools, graphical designers, and many more features to ease the software development process.
    The Visual Studio 2019 IDE
    This image shows Visual Studio with an open project and several key tool windows you’ll likely use:
    • Solution Explorer (top right) lets you view, navigate, and manage your code files. Solution Explorer can help organize your code by grouping the files into solutions and projects.
    • The editor window (center), where you’ll likely spend a majority of your time, displays file contents. This is where you can edit code or design a user interface such as a window with buttons and text boxes.

    Editions

    Visual Studio is available for Windows and Mac. Visual Studio for Mac has many of the same features as Visual Studio 2019, and is optimized for developing cross-platform and mobile apps. This article focuses on the Windows version of Visual Studio 2019.
    There are three editions of Visual Studio 2019: Community, Professional, and Enterprise. See Compare Visual Studio IDEs to learn about which features are supported in each edition.
    Some of the popular features in Visual Studio that help you to be more productive as you develop software include:
    • Squiggles and Quick Actions
      Squiggles are wavy underlines that alert you to errors or potential problems in your code as you type. These visual clues enable you to fix problems immediately without waiting for the error to be discovered during build or when you run the program. If you hover over a squiggle, you see additional information about the error. A light bulb may also appear in the left margin with actions, known as Quick Actions, to fix the error.
      Squiggles in Visual Studio
    • Refactoring includes operations such as intelligent renaming of variables, extracting one or more lines of code into a new method, changing the order of method parameters, and more.
      Refactoring in Visual Studio
    • IntelliSense is a term for a set of features that displays information about your code directly in the editor and, in some cases, write small bits of code for you. It’s like having basic documentation inline in the editor, which saves you from having to look up type information elsewhere. IntelliSense features vary by language. For more information, see C# IntelliSenseVisual C++ IntelliSenseJavaScript IntelliSense, and Visual Basic IntelliSense. The following illustration shows how IntelliSense displays a member list for a type:
      Visual Studio Member List
    • Search box
      Visual Studio can seem overwhelming at times with so many menus, options, and properties. The search box is a great way to rapidly find what you need in Visual Studio. When you start typing the name of something you’re looking for, Visual Studio lists results that take you exactly where you need to go. If you need to add functionality to Visual Studio, for example to add support for an additional programming language, the search box provides results that open Visual Studio Installer to install a workload or individual component.
       Tip
      Press Ctrl+Q as a shortcut to the search box.
      Search box in Visual Studio 2019
    • Collaboratively edit and debug with others in real time, regardless of what your app type or programming language. You can instantly and securely share your project and, as needed, debugging sessions, terminal instances, localhost web apps, voice calls, and more.
    • The Call Hierarchy window shows the methods that call a selected method. This can be useful information when you’re thinking about changing or removing the method, or when you’re trying to track down a bug.
      Call Hierarchy window
    • CodeLens helps you find references to your code, changes to your code, linked bugs, work items, code reviews, and unit tests, all without leaving the editor.
      CodeLens
    • The Go To Definition feature takes you directly to the location where a function or type is defined.
      Go to Definition
    • The Peek Definition window shows the definition of a method or type without actually opening a separate file.
      Peek to Definition

    Install the Visual Studio IDE

    In this section, you’ll create a simple project to try out some of the things you can do with Visual Studio. You’ll use IntelliSense as a coding aid, debug an app to see the value of a variable during the program’s execution, and change the color theme.
    To get started, download Visual Studio and install it on your system. The modular installer enables you to choose and install workloads, which are groups of features needed for the programming language or platform you prefer. To follow the steps for creating a program, be sure to select the .NET Core cross-platform development workload during installation.
    .NET Core cross-platform development workload in Visual Studio Installer
    When you open Visual Studio for the first time, you can optionally sign in using your Microsoft account or your work or school account.

    Create a program

    Let’s dive in and create a simple program.
    1. Open Visual Studio.
      The start window appears with various options for cloning a repo, opening a recent project, or creating a brand new project.
    2. Choose Create a new project.
      Visual Studio start window create a new project
      The Create a new project window opens and shows several project templates. A template contains the basic files and settings needed for a given project type.
    3. To find the template we want, type or enter .net core console in the search box. The list of available templates is automatically filtered based on the keywords you entered. You can further filter the template results by choosing C# from the Language drop-down list. Select the Console App (.NET Core) template, and then choose Next.
      Create a new project in Visual Studio
    4. In the Configure your new project window, enter HelloWorld in the Project namebox, optionally change the directory location for your project files, and then choose Create.
      Configure new project in Visual Studio
      Visual Studio creates the project. It’s a simple “Hello World” application that calls the Console.WriteLine() method to display the literal string “Hello World!” in the console (program output) window.
      Shortly, you should see something like the following:
      Visual Studio IDE
      The C# code for your application shows in the editor window, which takes up most of the space. Notice that the text is automatically colorized to indicate different parts of the code, such as keywords and types. In addition, small, vertical dashed lines in the code indicate which braces match one another, and line numbers help you locate code later. You can choose the small, boxed minus signs to collapse or expand blocks of code. This code outlining feature lets you hide code you don’t need, helping to minimize onscreen clutter. The project files are listed on the right side in a window called Solution Explorer.
      Visual Studio IDE with red boxes
      There are other menus and tool windows available, but let’s move on for now.
    5. Now, start the app. You can do this by choosing Start Without Debugging from the Debug menu on the menu bar. You can also press Ctrl+F5.
      Start without debugging menu” data-linktype=”relative-path” src=”https://docs.microsoft.com/en-us/visualstudio/get-started/media/overview-start-without-debugging.png?view=vs-2019&#8243; style=”border: 0px; box-sizing: inherit; display: inline-block; height: auto; max-width: 100%;” />
      Visual Studio builds the app, and a console window opens with the message Hello World!. You now have a running app!
      Console window
    6. To close the console window, press any key on your keyboard.
    7. Let’s add some additional code to the app. Add the following C# code before the line that says Console.WriteLine("Hello World!");:
      C#Copy
      <code class="lang-csharp" data-author-content="Console.WriteLine("\nWhat is your name?");
      var name = Console.ReadLine();
      " style="border: 0px; box-sizing: inherit; direction: ltr; display: block; font-family: SFMono-Regular, Consolas, "Liberation Mono", Menlo, Courier, monospace; font-size: 1em; line-height: 19px; padding: 0px; position: relative;">Console.WriteLine("\nWhat is your name?");
      var name = Console.ReadLine();
      This code displays What is your name? in the console window, and then waits until the user enters some text followed by the Enter key.
    8. Change the line that says Console.WriteLine("Hello World!"); to the following code:
      C#Copy
      <code class="lang-csharp" data-author-content="Console.WriteLine($"\nHello {name}!");
      " style="border: 0px; box-sizing: inherit; direction: ltr; display: block; font-family: SFMono-Regular, Consolas, "Liberation Mono", Menlo, Courier, monospace; font-size: 1em; line-height: 19px; padding: 0px; position: relative;">Console.WriteLine($"\nHello {name}!");
    9. Run the app again by selecting Debug > Start Without Debugging or by pressing Ctrl+F5.
      Visual Studio rebuilds the app, and a console window opens and prompts you for your name.
    10. Enter your name in the console window and press Enter.
      Console window
    11. Press any key to close the console window and stop the running program.

    Use refactoring and IntelliSense

    Let’s look at a couple of the ways that refactoring and IntelliSense can help you code more efficiently.
    First, let’s rename the name variable:
    1. Double-click the name variable to select it.
    2. Type in the new name for the variable, username.
      Notice that a gray box appears around the variable, and a light bulb appears in the margin.
    1. Select the light bulb icon to show the available Quick Actions. Select Rename ‘name’ to ‘username’.
      Rename action in Visual Studio
      The variable is renamed across the project, which in our case is only two places.
    1. Now let’s take a look at IntelliSense. Below the line that says Console.WriteLine($"\nHello {username}!");, type DateTime now = DateTime..
      A box displays the members of the DateTime class. In addition, the description of the currently selected member displays in a separate box.
      IntelliSense list members in Visual Studio
    2. Select the member named Now, which is a property of the class, by double-clicking on it or pressing Tab. Complete the line of code by adding a semi-colon to the end.
    3. Below that, type in or paste the following lines of code:
      C#Copy
      <code class="lang-csharp" data-author-content="int dayOfYear = now.DayOfYear;

      Console.Write("Day of year: ");
      Console.WriteLine(dayOfYear);
      " style="border: 0px; box-sizing: inherit; direction: ltr; display: block; font-family: SFMono-Regular, Consolas, "Liberation Mono", Menlo, Courier, monospace; font-size: 1em; line-height: 19px; padding: 0px; position: relative;">int dayOfYear = now.DayOfYear;

      Console.Write("Day of year: ");
      Console.WriteLine(dayOfYear);
       Tip
      Console.Write is a little different to Console.WriteLine in that it doesn’t add a line terminator after it prints. That means that the next piece of text that’s sent to the output will print on the same line. You can hover over each of these methods in your code to see their description.
    4. Next, we’ll use refactoring again to make the code a little more concise. Click on the variable now in the line DateTime now = DateTime.Now;.
      Notice that a little screwdriver icon appears in the margin on that line.
    5. Click the screwdriver icon to see what suggestions Visual Studio has available. In this case, it’s showing the Inline temporary variable refactoring to remove a line of code without changing the overall behavior of the code:
      Inline temporary variable refactoring in Visual Studio
    6. Click Inline temporary variable to refactor the code.
    1. Run the program again by pressing Ctrl+F5. The output looks something like this:
      Console window with program output

    Debug code

    When you write code, you need to run it and test it for bugs. Visual Studio’s debugging system lets you step through code one statement at a time and inspect variables as you go. You can set breakpoints that stop execution of the code at a particular line. You can observe how the value of a variable changes as the code runs, and more.
    Let’s set a breakpoint to see the value of the username variable while the program is “in flight”.
    1. Find the line of code that says Console.WriteLine($"\nHello {username}!");. To set a breakpoint on this line of code, that is, to make the program pause execution at this line, click in the far left margin of the editor. You can also click anywhere on the line of code and then press F9.
      A red circle appears in the far left margin, and the code is highlighted in red.
      Breakpoint on line of code in Visual Studio
    2. Start debugging by selecting Debug > Start Debugging or by pressing F5.
    3. When the console window appears and asks for your name, type it in and press Enter.
      The focus returns to the Visual Studio code editor and the line of code with the breakpoint is highlighted in yellow. This signifies that it’s the next line of code that the program will execute.
    4. Hover your mouse over the username variable to see its value. Alternatively, you can right-click on username and select Add Watch to add the variable to the Watch window, where you can also see its value.
      Variable value during debugging in Visual Studio
    5. To let the program run to completion, press F5 again.
    To get more details about debugging in Visual Studio, see Debugger feature tour.

    Customize Visual Studio

    You can personalize the Visual Studio user interface, including change the default color theme. To change to the Dark theme:
    1. On the menu bar, choose Tools > Options to open the Options dialog.
    1. On the Environment > General options page, change the Color theme selection to Dark, and then choose OK.
      The color theme for the entire IDE changes to Dark.
      Visual Studio in dark theme
    To learn about other ways you can personalize the IDE, see Personalize Visual Studio.

    Create a tip calculator app – Xamarin iOS

    Create a tip calculator app – Xamarin iOS


    In this exercise, you walk through the creation of a new Xamarin.iOS application with Visual Studio 2019. You can also use Visual Studio 2017 or Visual Studio for Mac, but keep in mind that some steps might be slightly different.
    The primary goal of this exercise is to disable the default Storyboard UI from the TipCalculator project you created in the previous exercise. After that, you replace it with a code-based UIViewController, which will be set as the RootViewController for the application.
     Note
    Running Xamarin.iOS apps on devices or simulators requires a connected macOS build host machine. For more information, review the Pair to Mac for Xamarin.iOS development doc.

    Create Single View App

    1. Launch Visual Studio.
    2. To start the project creation wizard, select Create a new project on the Visual Studio start page. You can also access the new project dialog in the File > New > Project menu.
      Screenshot showing the Visual Studio's create new project option.
    3. Use the search term xamarin and filter the project types in the Create a new project dialog. Select the iOS App (Xamarin) template from the filtered list of options.
      Selecting the iOS project template in Visual Studio.
    4. Give your new project the name TipCalculator and select Create.
     Note
    During the project creation process, you might be prompted to connect to a Xamarin build host. For more information, see Connecting to the Mac.
    On the next screen:
    1. Select the Single View App template.
    2. Leave the Device Support as Universal to support both iPad and iPhone devices.
    3. Pick your preferred Minimum iOS Version or leave it set to the newest version.
    4. Click OK to create the project.
      Configuring the template and support options for the iOS project.
      Visual Studio creates and loads a new solution with a single iOS project.
      List of files and nodes in the Visual Studio Solution Explorer after creating initial iOS project.

    Delete boiler plate code

    The Single View App template creates both a Storyboard UI and a view controller with some basic overrides that are linked to the UI. We want to start from scratch in this app. In this step, we’ll delete the existing view controller code and replace it with a new C# class to act as our primary view controller.
    1. Open your TipCalculator solution.
    2. Locate ViewController.cs.
    3. Right-click and then select Delete.

    Add a new class

    1. You can add a new class file to the project in two ways:
      • Select Project > Add Class from the menu.
      • Select Add > Class from the project context menu
    2. In the Apple category, select Class – the empty class template. Enter MyViewController as the name for your class file.
    3. Select Add to create the file and add it to your project.
    Screenshot of Visual Studio showing the Add New Item dialog with the Class item selected

    Inherit from UIViewController

    1. Open the new source file.
    2. Make sure to set the class constructor to public and update the class to derive from UIViewController.
    3. You need to fully qualify the class or add the UIKit namespace using statement to the file.
      C#Copy
      <code class="lang-csharp" data-author-content="using System;
      using UIKit;

      namespace TipCalculator
      {
      public class MyViewController : UIViewController
      {
      public MyViewController()
      {
      }
      }
      }
      " style="border: 0px; box-sizing: inherit; direction: ltr; display: block; font-family: SFMono-Regular, Consolas, "Liberation Mono", Menlo, Courier, monospace; font-size: 1em; line-height: 19px; padding: 0px; position: relative;">using System;
      using UIKit;

      namespace TipCalculator
      {
      public class MyViewController : UIViewController
      {
      public MyViewController()
      {
      }
      }
      }

    Assign a UIWindow

    1. Open AppDelegate.cs.
    2. Locate the FinishedLaunching method and remove all of the code and comments from within the method.
    3. Create a new UIWindow object and assign it. The constructor for UIWindow takes a CGRect structure, which defines the rectangle that the window will cover. You want it to cover the entire device screen so use the static property UIScreen.MainScreen.Bounds as the parameter.
    4. Assign the created UIWindow to the existing Window property.
      C#Copy
      <code class="lang-csharp" data-author-content="public override bool FinishedLaunching(UIApplication application, NSDictionary launchOptions)
      {
      // Create a new window instance based on the screen size
      Window = new UIWindow(UIScreen.MainScreen.Bounds);
      }
      " style="border: 0px; box-sizing: inherit; direction: ltr; display: block; font-family: SFMono-Regular, Consolas, "Liberation Mono", Menlo, Courier, monospace; font-size: 1em; line-height: 19px; padding: 0px; position: relative;">public override bool FinishedLaunching(UIApplication application, NSDictionary launchOptions)
      {
      // Create a new window instance based on the screen size
      Window = new UIWindow(UIScreen.MainScreen.Bounds);
      }

    Display a view controller

    1. Create a new instance of MyViewController and assign it to the Window.RootViewController property. This assignment displays your view controller (and the view it controls) as the initial screen when the app starts.
      C#Copy
      <code class="lang-csharp" data-author-content="public override bool FinishedLaunching(UIApplication application, NSDictionary launchOptions)
      {
      // Create a new window instance based on the screen size
      Window = new UIWindow(UIScreen.MainScreen.Bounds);

      // Assign the root view controller
      Window.RootViewController = new MyViewController();
      }
      " style="border: 0px; box-sizing: inherit; direction: ltr; display: block; font-family: SFMono-Regular, Consolas, "Liberation Mono", Menlo, Courier, monospace; font-size: 1em; line-height: 19px; padding: 0px; position: relative;">public override bool FinishedLaunching(UIApplication application, NSDictionary launchOptions)
      {
      // Create a new window instance based on the screen size
      Window = new UIWindow(UIScreen.MainScreen.Bounds);

      // Assign the root view controller
      Window.RootViewController = new MyViewController();
      }

    Set the primary window

    1. To direct iOS to make this new window the primary or key window, you need to call the MakeKeyAndVisible method on the UIWindow object.
    2. Return true from the method to finish the implementation.
      C#Copy
      <code class="lang-csharp" data-author-content="public override bool FinishedLaunching(UIApplication application, NSDictionary launchOptions)
      {
      // Create a new window instance based on the screen size
      Window = new UIWindow(UIScreen.MainScreen.Bounds);

      // Assign the root view controller
      Window.RootViewController = new MyViewController();

      // Make the window visible
      Window.MakeKeyAndVisible();

      return true;
      }
      " style="border: 0px; box-sizing: inherit; direction: ltr; display: block; font-family: SFMono-Regular, Consolas, "Liberation Mono", Menlo, Courier, monospace; font-size: 1em; line-height: 19px; padding: 0px; position: relative;">public override bool FinishedLaunching(UIApplication application, NSDictionary launchOptions)
      {
      // Create a new window instance based on the screen size
      Window = new UIWindow(UIScreen.MainScreen.Bounds);

      // Assign the root view controller
      Window.RootViewController = new MyViewController();

      // Make the window visible
      Window.MakeKeyAndVisible();

      return true;
      }

    Build and run app

    Next, you select the deployment target for your new iOS application. In this example, you use the iOS simulator which requires an active connection to your Mac build host.
    1. Choose iPhoneSimulator from the Solution Platforms dropdown on the Visual Studio toolbar.
      Screenshot of Visual Studio showing iPhoneSimulator selected in the build target toolbar
      With iPhoneSimulator selected, you can now choose from the available simulators installed on the Mac. The available devices and versions might change when Xcode is updated on the Mac.
    2. Select any iPhone simulator.
      Screenshot of the Visual Studio toolbar list of iOS simulators available on a Mac build host
      The simulator variations are created and installed through Xcode on your Mac build host. Visual Studio reads the configuration and displays what’s available from the build host you’ve selected. If you don’t see the simulator image you’re looking for, you can create it through Xcode.

    Build the application

    Compile and deploy the application to the iOS Simulator. The application displays as a black screen when it’s up and running. You’ll fix the view’s background color in a following exercise.
    Start the application by selecting the Play button in the toolbar. This action builds and launches the application on the simulator. You can also build from the Build menu.
    Screenshot of the Visual Studio toolbar with the app play button highlighted
    Remember, the simulator is hosted on your Mac build host. With the Remoted iOS Simulator installed, a window launches on your Windows development machine to preview and interact with the iOS simulator directly. If the Remoted iOS Simulator isn’t installed, the simulator window appears and deploys on your Mac build host. Switch to your Mac to see the window there.
    For more information, see the Remoted iOS Simulator documentation.
    Congratulations! You’ve created a new iOS application with the Single View App template.
    You can view the completed solution in the exercise1 > final folder in your copy of the cloned or downloaded exercise repo from GitHub.

    Create a Xamarin.iOS app

    Create a Xamarin.iOS app


    Now that you have an overview of Xamarin.iOS, you’re ready to learn how to use it to create a new iOS app. This information should help you decide whether Xamarin.iOS is a good fit for your development team.
    Even though this module focuses on creating an iOS application, remember that Xamarin.iOS supports all variations of Apple devices.
    An illustration showing iPhone or iPad, macOS, AppleTV, and Apple Watch support through Xamarin.iOS

    Start a new Xamarin.iOS project

    The steps to create and run an Xamarin.iOS app start by opening Visual Studio or Visual Studio for Mac. This example shows the steps you take in Visual Studio 2019. First, you select the Create new project option.
    A screenshot showing Visual Studio 2019 Get started dialog
    The easiest way to find the available Xamarin project types is to filter the options using xamarin as your search term. Next, select the iOS App (Xamarin) option.
    A screenshot showing Visual Studio 2019 Get started dialog

    Choose an iOS project template

    Visual Studio has a set of installed project templates to create Apple applications in a few different styles.
    A screenshot showing Visual Studio 2019 Xamarin.iOS default templates
    Visual Studio 2019 gives you the option to choose one of the following default templates:
    Template Description
    Single View App Creates a simple application structure with a single, empty page. You use it in the following exercise.
    Master-Detail App Creates an application with two views:

    1. Master list of scrollable records, each of which represents a piece of data.
    2. Detail view for a single record.
    Tabbed App Creates a multi-page application with a tab at the bottom of the UI for accessing each page.
    Blank App Creates an application that doesn’t contain a visual design file called a Storyboard. Instead, it contains a single, coded view called a ViewController.

    Xamarin.iOS project structure

    Xamarin.iOS creates a standard .NET type solution with your new Xamarin.iOS project included. No matter which IDE choice you made earlier, this solution and project is usable on both Windows and Mac. Team members with different operating systems can continue development without interruptions.
    Here is an example of typical Single View App project:
    A screenshot showing Visual Studio 2019's Xamarin.iOS Single View Application project structure
    Notice that the project contains a number of items common to other .NET-based solutions. However, it also includes some items specific to iOS development, such as AppDelegateplist filesStoryboards, and ViewControllers. If you have an iOS development background, the familiarity of these items should make the transition from Swift and Objective-C to C# development easier.

    Build your application

    After you create your project, you can build it. To compile your code, you use the same technique as you do for any other app. You can use the Run button on the toolbar or in the Build menu.
    A screenshot showing Visual Studio 2019's Build Solution option
    You can view build warnings and errors in the Error window. Turn the window on and off through the View menu.
    Make sure you configure a connection to your Mac build host before you do a complete build of your application. Visual Studio prompts you to set up this connection if it isn’t available.
    Your Mac build host is properly configured if the icon is shown green.
    A screenshot showing Visual Studio 2019's Build host icon

    Test your application

    You have a couple of options for testing your application:
    • Test with the iOS Simulator.
      A screenshot showing Visual Studio 2019's Build Solution option
      The simulator comes with the iOS SDK and is distributed as part of your Xcode installation. The simulator allows you to select different form factors directly from the toolbar. For example, you can choose to run your app on an iPhone or iPad to see visual design differences.
    • Test on a Physical device.
      You can connect an Apple mobile device to your Mac with a USB cable and both IDEs will detect it.
      A screenshot showing Visual Studio 2019's Build Solution option
      Notice how the configuration option differs from the previous example where a simulator is selected. In this case, you select the iPhone build configuration to create native AOT package. Visual Studio for Mac will automatically select the proper configuration based on the device you’re deploying to.

    Requirements for deployment to a device

    Always test with a physical device during your development cycle because of runtime differences on the simulator. Configuring a physical device requires additional setup. For example, your apps must be signed with an Apple-supplied certificate, and test devices need to be registered with Apple’s developer portal.
    For instructions, see device provisioning for Xamarin.iOS.
    Design a site like this with WordPress.com
    Get started