
How you use Power BI might depend on your role on a project or a team. And other people, in other roles, might use Power BI differently, which is just fine.
For example, you might view reports and dashboards in the Power BI service, and that might be all you do with Power BI. But your number-crunching, business-report-creating coworker might make extensive use of Power BI Desktop (and publish Power BI Desktop reports to the Power BI service, which you then use to view them). And another coworker, in sales, might mainly use her Power BI phone app to monitor progress on her sales quotas and drill into new sales lead details.
You also might use each element of Power BI at different times, depending on what you’re trying to achieve, or what your role is for a given project or effort.
Perhaps you view inventory and manufacturing progress in a real-time dashboard in the service, and also use Power BI Desktop to create reports for your own team about customer engagement statistics. How you use Power BI can depend on which feature or service of Power BI is the best tool for your situation. But each part of Power BI is available to you, which is why it’s so flexible and compelling.
We discuss these three elements—Desktop, the service, and Mobile apps—in more detail later. In upcoming units and modules, we’ll also create reports in Power BI Desktop, share them in the service, and eventually drill into them on our mobile device.
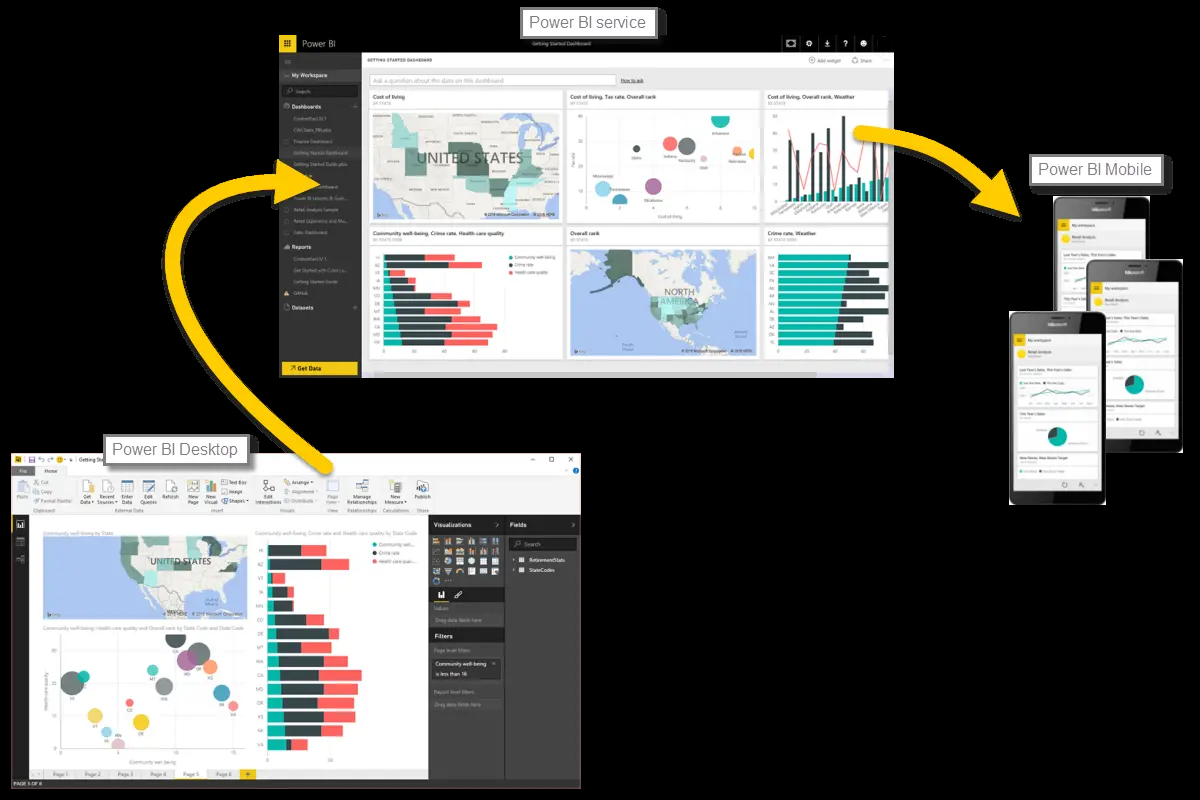
The flow of work in Power BI
A common flow of work in Power BI begins in Power BI Desktop, where a report is created. That report is then published to the Power BI service and finally shared, so that users of Power BI Mobile apps can consume the information.
It doesn’t always happen that way, and that’s okay. But we’ll use that flow to help you learn the different parts of Power BI and how they complement each other.
Okay, now that we have an overview of this module, what Power BI is, and its three main elements, let’s take a look at what it’s like to use Power BI.
Use Power BI
As you learn about all the things that can be done with Power BI, keep in mind that all these activities, and all the analysis that’s done with Power BI, generally follow a common flow. The common flow of activity in Power BI looks like this:
- Bring data into Power BI Desktop, and create a report.
- Publish to the Power BI service, where you can create new visualizations or build dashboards.
- Share dashboards with others, especially people who are on the go.
- View and interact with shared dashboards and reports in Power BI Mobile apps.
As mentioned earlier, you might spend all your time in the Power BI service, viewing visuals and reports that have been created by others. And that’s just fine. Someone else on your team might spend all her time in Power BI Desktop, which is fine too. To help you understand the full continuum of Power BI and what it can do, we’ll show you all of it. Then you can decide how to use it to your best advantage.

Enjoyed reading the article above, really explains everything in detail, the article is very interesting and effective. Thank you and good luck for the upcoming articles Power Bi training
LikeLike